
I’m really sinking my teeth into Adobe Experience Platform (AEP) and wanted to share a few quick tips about debugging AEP that I’ve found helpful. If you’re reading this, you are probably already using the AEP Debugger. I also recommend checking out David Vallejo’s Analytics Debugger, which is an awesome AEP object explorer. Anyway, I want to cover stuff for folks who don’t always rely on custom DevTools debuggers. We’re going to keep this relatively short, so let’s jump in.
Table of Contents
Finding the XDM Object
Before we do anything, we need to find the Experience Data Model (XDM) object. That includes the entire payload being sent into AEP. To do this, we’re going to look for the interact object in the Network tab.
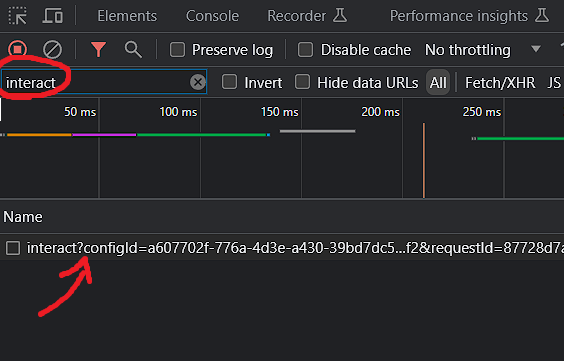
If you’re having trouble finding a website that is running AEP, refresh this page and look at your network tab (I have it installed). Go ahead and click on that line and go to the Payload tab:
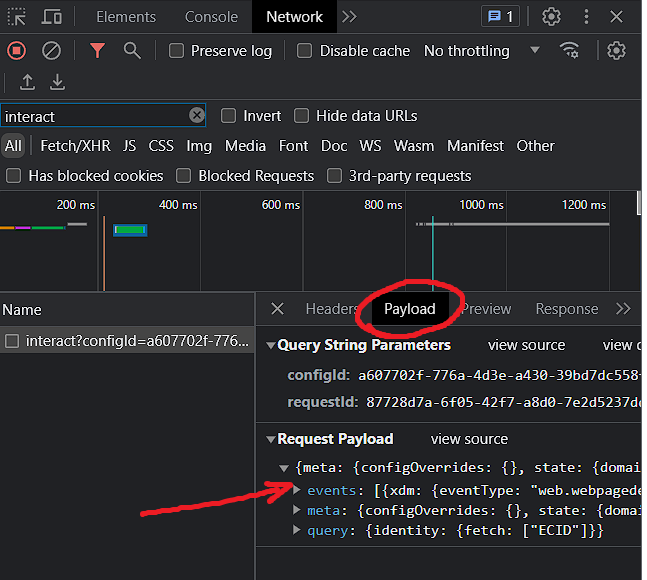
Tadaa! That was easy. Explore the payload by expanding the events object (where the arrow is pointing). I guess that’s tip number 1: how to find the payload.
Finding the Datastream
If you’re like me and happen to manage a lot of different clients – or clients with a lot of different properties – you’ll often have a tough time remembering what Schema, Dataset, or Datastream you’re using for the website. While you could dig it up in Adobe Launch, it’s often easier to have the Datastreams section open in another tab. The easiest way to identify the Datastream the server call is being shot into, use the configId in the Payload section:
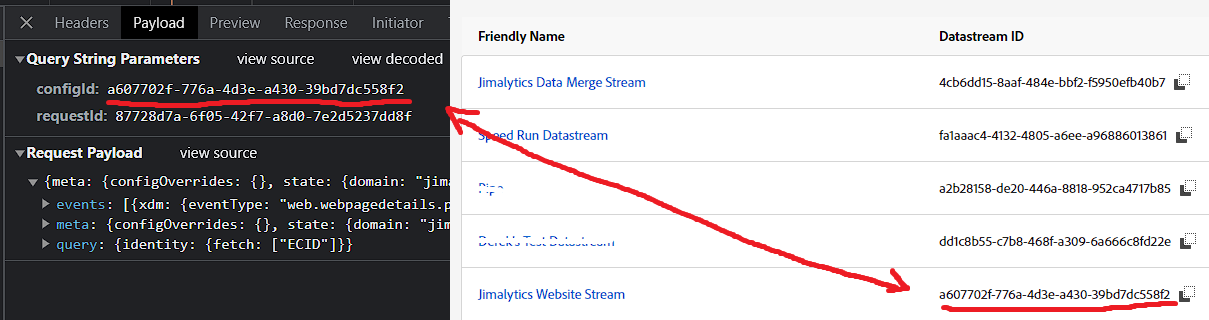
As nice is this is, you can’t actually search for the ID in the interface – and it’s aggressively paginated. However, for most people this isn’t an issue. When you’re messing around with AEP you’ll find that sometimes you name things similarly – knowing and locating the ID helps.
Finding Specific Server Calls
When testing, it is sometimes really nice to have a specific identifier for a server call. For instance, you might want to see how a certain payload looks after processing and before it reaches your Dataset. To do this, use the requestId parameter just below the configId:
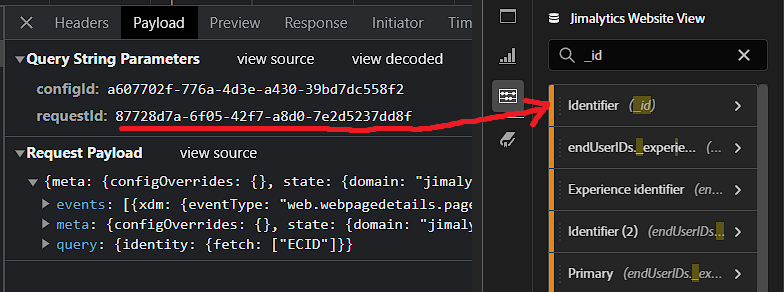
The default “Identifier” dimension in your CJA data view stores that value (that’s its common key). Just store the requestId somewhere so you can reference it later then filter the dimension for the value. Easy peasy.
Add an ECID Field
Or use an existing one. The ECID is set in a cookie, but is not automatically ingested and exposed as a usable parameter in CJA. You may need to manually add a field to your schema to slot in the value. I say “may need to” because the Adobe Analytics schema has a field for mcid in there by default (see below):
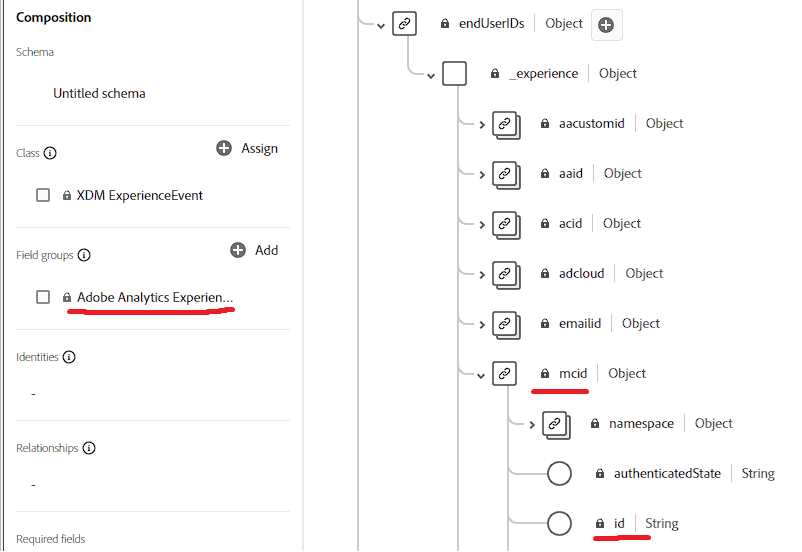
Why is it using the old name of mcid instead of ecid? I don’t know. Maybe Adobe has a good answer to that.
Final Thoughts
This won’t be my last article about this stuff. To be completely honest, AEP can be difficult to use. Most analytics platforms are nearly prohibitive for marketers nowadays (looking at you, GA4). It’s disappointing; and as I’ve stated in other articles, further abstracts data from the business, turning the decision-making process into a nauseating game of telephone between the CEO and the analyst. That said, the Adobe product teams have been incredibly receptive to feedback, they nurture a supportive community, and continuously takes big strides to improve its UX. There’s still a long way to go.
Look for more long-form instructional content as I continue to work with AEP. Next, we’ll likely talk about how to expand dimensions and integrate data into Adobe’s Realtime CDP. In it, I’ll talk about how I spent 3 hours committing and debugging batch failures.